As a party to the Climate Convention and the Kyoto Protocol, the European Union is obliged to submit a complete annual inventory of the greenhouse gas emissions of all member states. This is published in the „European Union greenhouse gas inventory and inventory report“ by the European Environment Agency (EEA). For engineering practice in the waste management sector - as is the case with BIG - Part of SIERA Alliance at the Hanover site - this data forms an essential basis for the evaluation of emissions trends and long-term reduction strategies.
The complete inventory report „Annual European Union greenhouse gas inventory 1990-2023 and inventory report 2025“ is published by the European Environment Agency and is publicly available. Supplementary data analyses can be viewed via the EEA's Greenhouse Gas Data Viewer:
http://www.eea.europa.eu/data-and-maps/data/data-viewers/greenhouse-gases-viewer
System for recording emissions in the EU
The emissions of the seven most important greenhouse gases are recorded:
- Carbon dioxide (CO₂)
- Methane (CH₄)
- Nitrous oxide (N₂O)
- Hydrofluorocarbons containing hydrogen
- perfluorinated hydrocarbons
- Sulphur hexafluoride
- Nitrogen trifluoride
The conversion is made in CO₂ equivalents (CO₂eq).
Emissions are allocated according to the Common Reporting Framework (CRF) of the Intergovernmental Panel on Climate Change. A distinction is made between six sectors.
The six CRF sectors at a glance
| CRF sector | Content categorisation |
| Energy | Energy generation and consumption |
| Industrial processes and product use | Industrial processes and product utilisation |
| Agriculture | Agriculture |
| LULUCF | Land use, land use change and forestry |
| Waste | Waste management |
| Other | Other emissions |
One of these sectors is the Waste management, which is reported separately in the European emissions inventory.
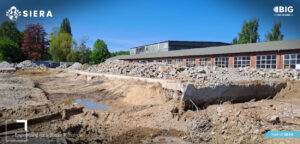
Generation of greenhouse gas emissions in waste management
Waste management generates emissions along the entire process chain.
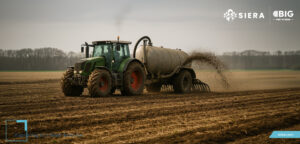
1. collection and transport
CO₂ is already produced during the collection and transport of waste - usually by large collection vehicles.
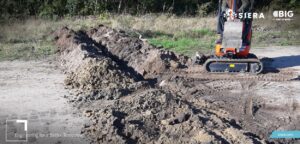
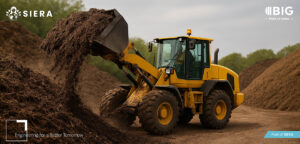
2. preparation and sorting
Emissions are also produced during technical processing, for example through:
- Transport units
- Sorting plants
- Mechanical treatment processes
However, these emissions do not arise directly from the waste treatment itself, but from the generation of energy for the machines used. For this reason, they are not allocated to the waste sector in the EEA inventory report, but to the Energy sector attributed.
The Waste incineration with energy recovery to the energy sector in order to avoid double counting of greenhouse gas emissions.
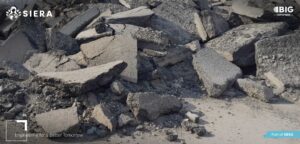
Direct emissions from treatment processes
In addition to energy-related emissions, greenhouse gases are produced directly as part of waste treatment processes. These are attributed to the waste sector.
The categorisation is divided into five categories:
- Solid waste disposal
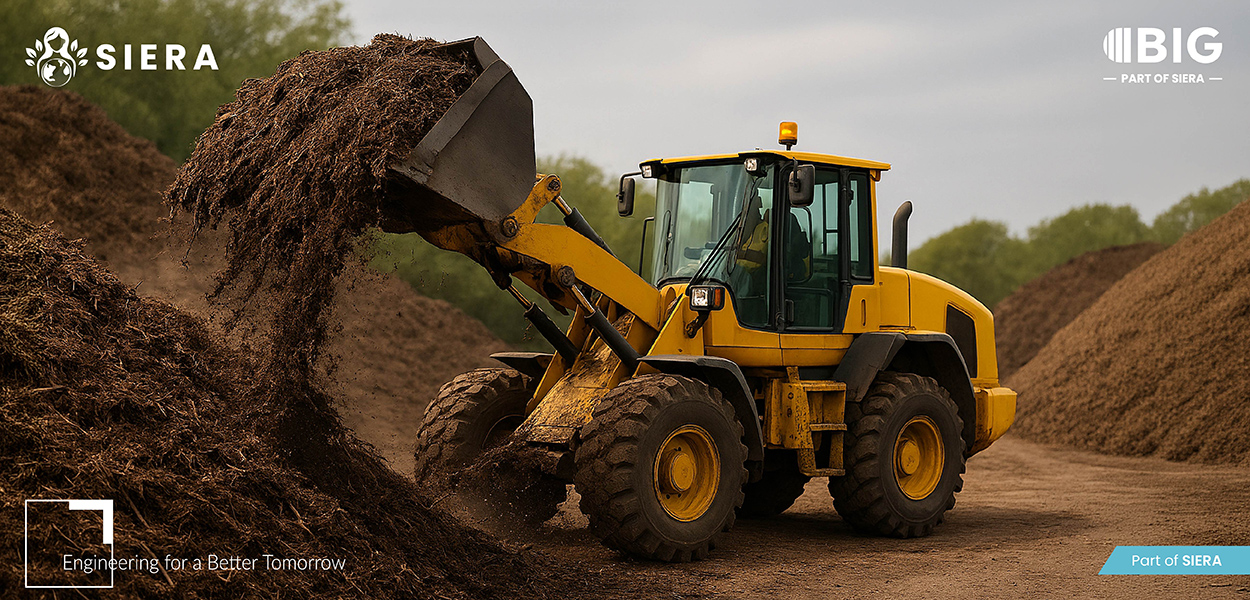
- Biological treatment of solid waste
- Incineration and open burning
- Wastewater treatment and discharge
- Other
This differentiation makes it possible to precisely analyse the sources of emissions within the waste management sector.
Share of emissions from the waste sector in 2023
In the year 2023 3.7 % of total greenhouse gas emissions excluding LULUCF on the waste sector.
CO₂ emissions resulting from biodegradation or the incineration of waste of non-fossil origin are not taken into account. These are considered climate-neutral.
Development since 1990
The emissions trend in the waste sector shows a significant decline:
| Year | emissions (million tonnes CO₂eq) | Change |
| 1990 | 185 | Reference year |
| 2023 | 109 | -41 % |
Since 1990, emissions in the waste sector have fallen by 41 % decreased.
Causes of the decline in emissions
The reduction is largely due to the further development of treatment and disposal options for municipal waste.
In many member states is:
- the proportion of landfilled waste has fallen
- Recycling has been expanded
- Composting has been strengthened
- Landfill gas collection has been improved
- Waste incineration with energy recovery increased
The largest decline is in the CH₄ emissions from organised landfills to be recorded. Nevertheless, these still account for around 60 % of emissions in the waste sector from.
Trend and future development
Overall, greenhouse gas emissions in the waste sector have shown a steady downward trend in recent years.
However, many member states with previously high emissions have already reduced them by more than 75 %. In these countries, most of the technical possibilities have been largely exhausted.
In future, therefore, a Slowdown in the reduction trend to be reckoned with.
Continued high reduction potential
Despite this development, the potential for reducing greenhouse gas emissions in the waste sector remains high. Significant reductions can be achieved with comparatively simple measures.
This is where engineering expertise plays a decisive role. Through:
- Systematic emission analyses
- Technical process optimisation
- Further development of treatment procedures
- Sustainable infrastructure planning
further reductions can be realised.
In this context, BIG makes a technically sound contribution in the field of waste management.
BIG's responsibility and contribution
As part of a wide range of measures BIG - Part of SIERA Alliance to further reduce greenhouse gas emissions through climate-friendly and technically sound solutions.
BIG's expertise in waste management includes, among other things:
- Analysing material flows
- Evaluation of emission sources
- Optimisation of treatment processes
- Development of sustainable waste disposal concepts
Through these measures, BIG supports the continuous development of low-emission infrastructures in the waste sector.
The team from BIG - Part of SIERA Alliance in Hanover supports you with sound engineering expertise in the development of sustainable solutions in the waste sector.
Get in touch and design sustainable infrastructures with us.
Engineering for a Better Tomorrow.